Turn your
into publication-ready figures.
Upload your data, choose a scientific template, refine your figure, and export it for publication — without rebuilding every plot from scratch.
Start from Excel · No installation · Publication-ready export
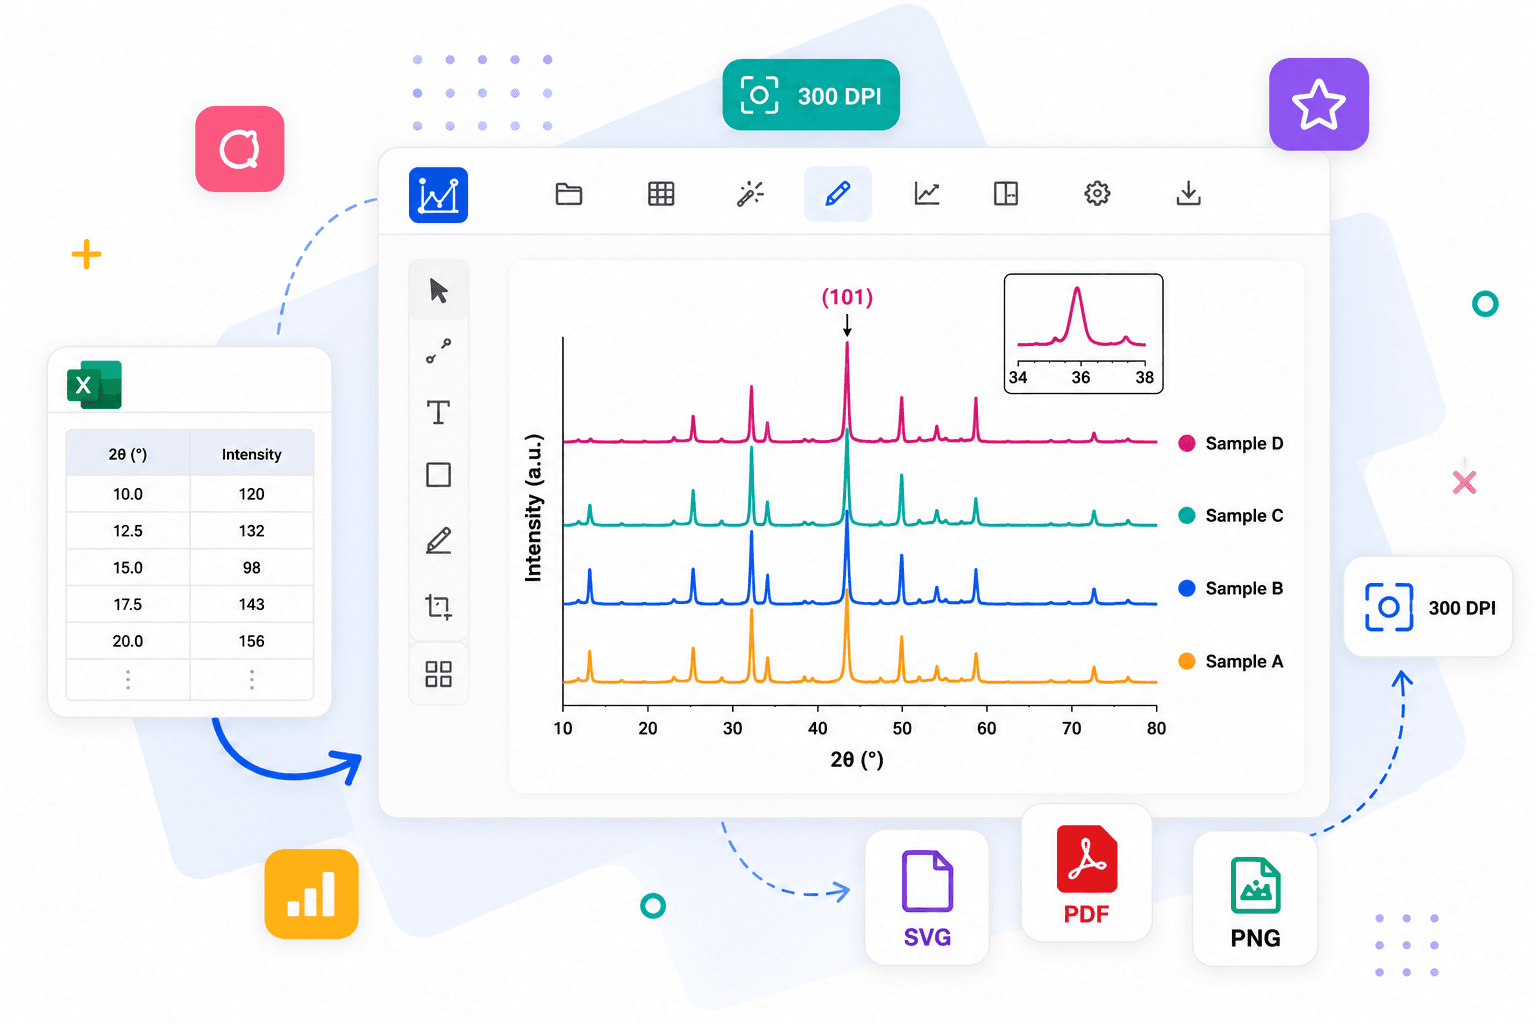
From raw data to publication-ready figure in seconds
Data
X axis
Y axis
XRD Pattern — SiO₂ (Quartz)
Style
Color palette
Axes
Export
Trusted by researchers from leading institutions







Researchers switching from OriginLab & Prism
See why scientists are choosing FigureReady over legacy tools for their publication figures.
“I used to spend hours reformatting XRD figures in OriginLab. With FigureReady, I get publication-ready output in minutes — no more fighting with axis settings or font sizes.”

Dr. Sarah M.
Postdoc, Materials Science · ETH Zürich
“GraphPad Prism handles the stats well, but the figure quality never matched what journals expect. FigureReady gives me Nature-ready dose-response figures straight away.”

Thomas K.
PhD candidate, Pharmacology · Université Paris Cité
“OriginLab's learning curve was too steep for quick figures. FigureReady has FTIR and UV-Vis templates pre-configured exactly as I need them — I just import my data and export.”

Dr. Amina B.
Researcher, Spectroscopy · CNRS
“I recommended FigureReady to my whole lab. No more inconsistent styling or wasted hours trying to make Prism figures look presentable for submission.”

Prof. J. Chen
Principal Investigator · National University of Singapore
Start with your data
Import your experimental data and turn raw columns into a clean scientific figure in seconds. Select the data you want to plot and let FigureReady handle the starting point.
Upload your data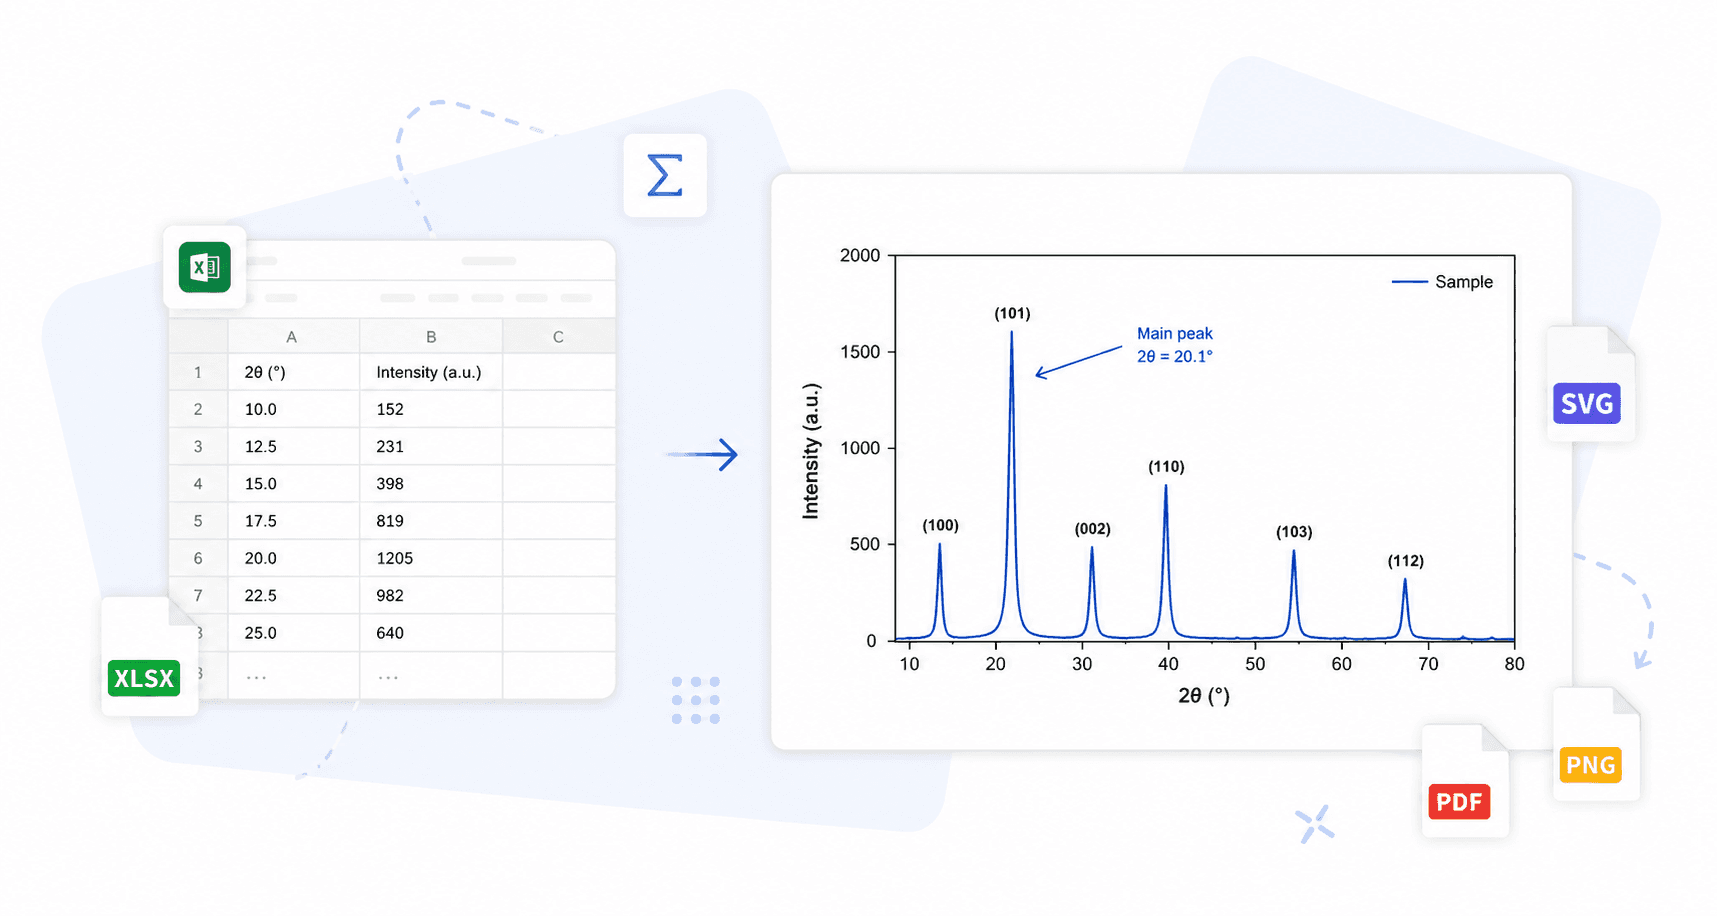
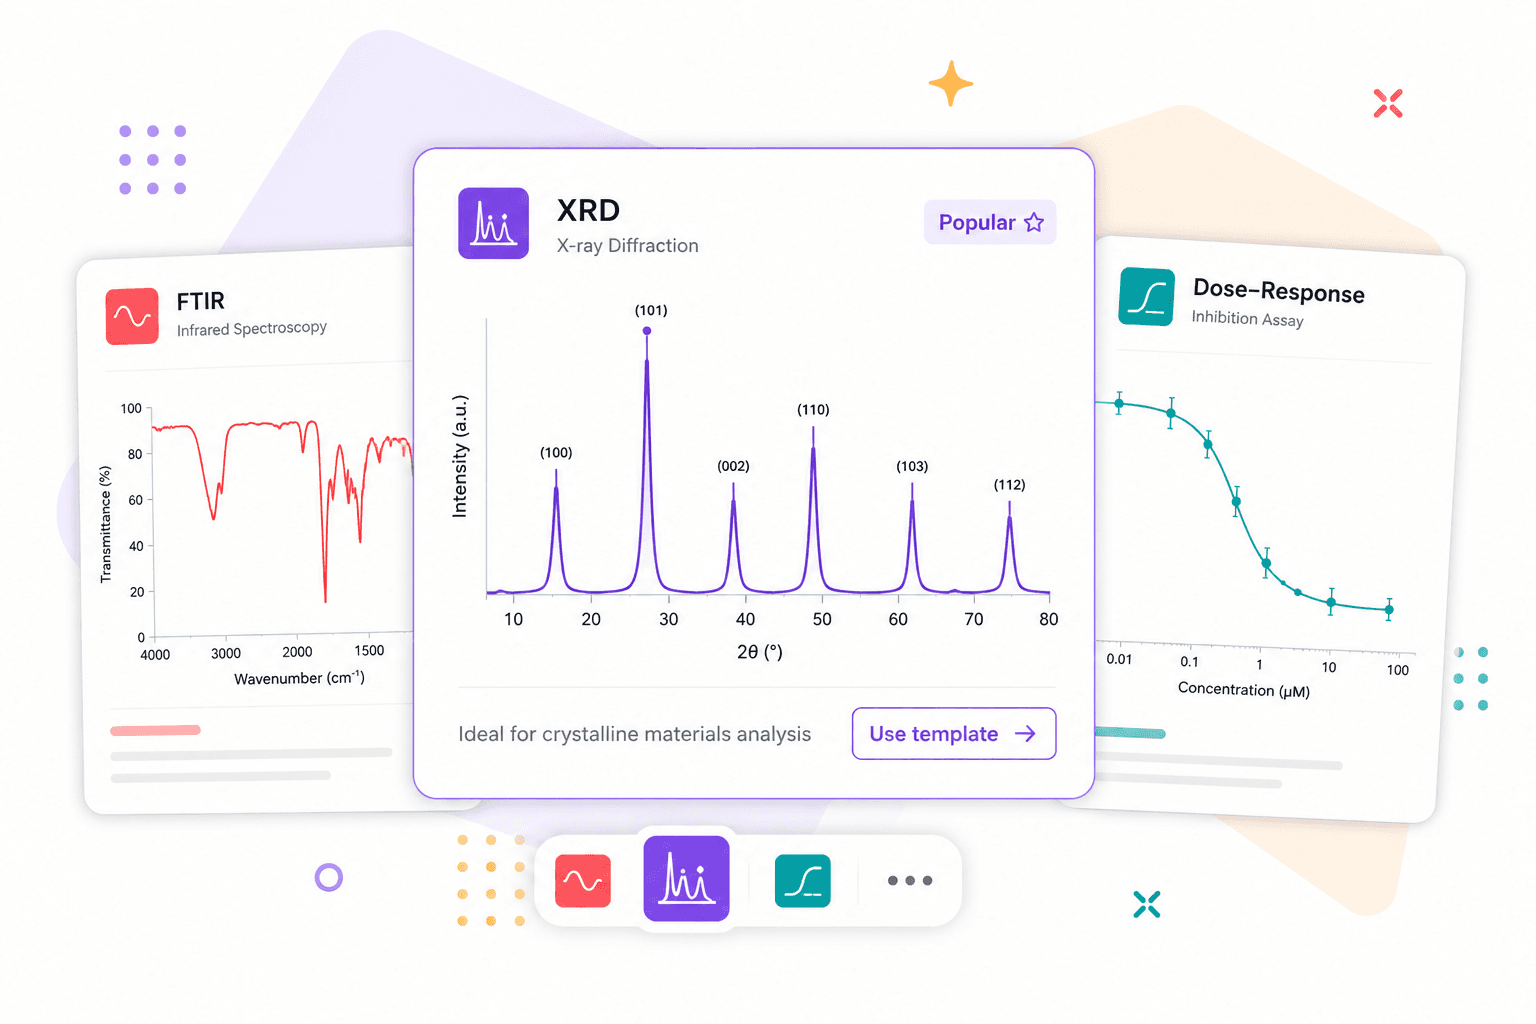
Start from a scientific template, not a blank canvas
Choose a figure designed for your experiment. FTIR, XRD, UV–Vis, photoluminescence, dose–response and more — with scientific defaults already in place.
Explore scientific templatesMore templates added regularly.
Refine every detail
Adjust axes, labels, colors and series directly on your figure. Add peak labels, arrows, text and scientific annotations without switching to another application.
Explore the editor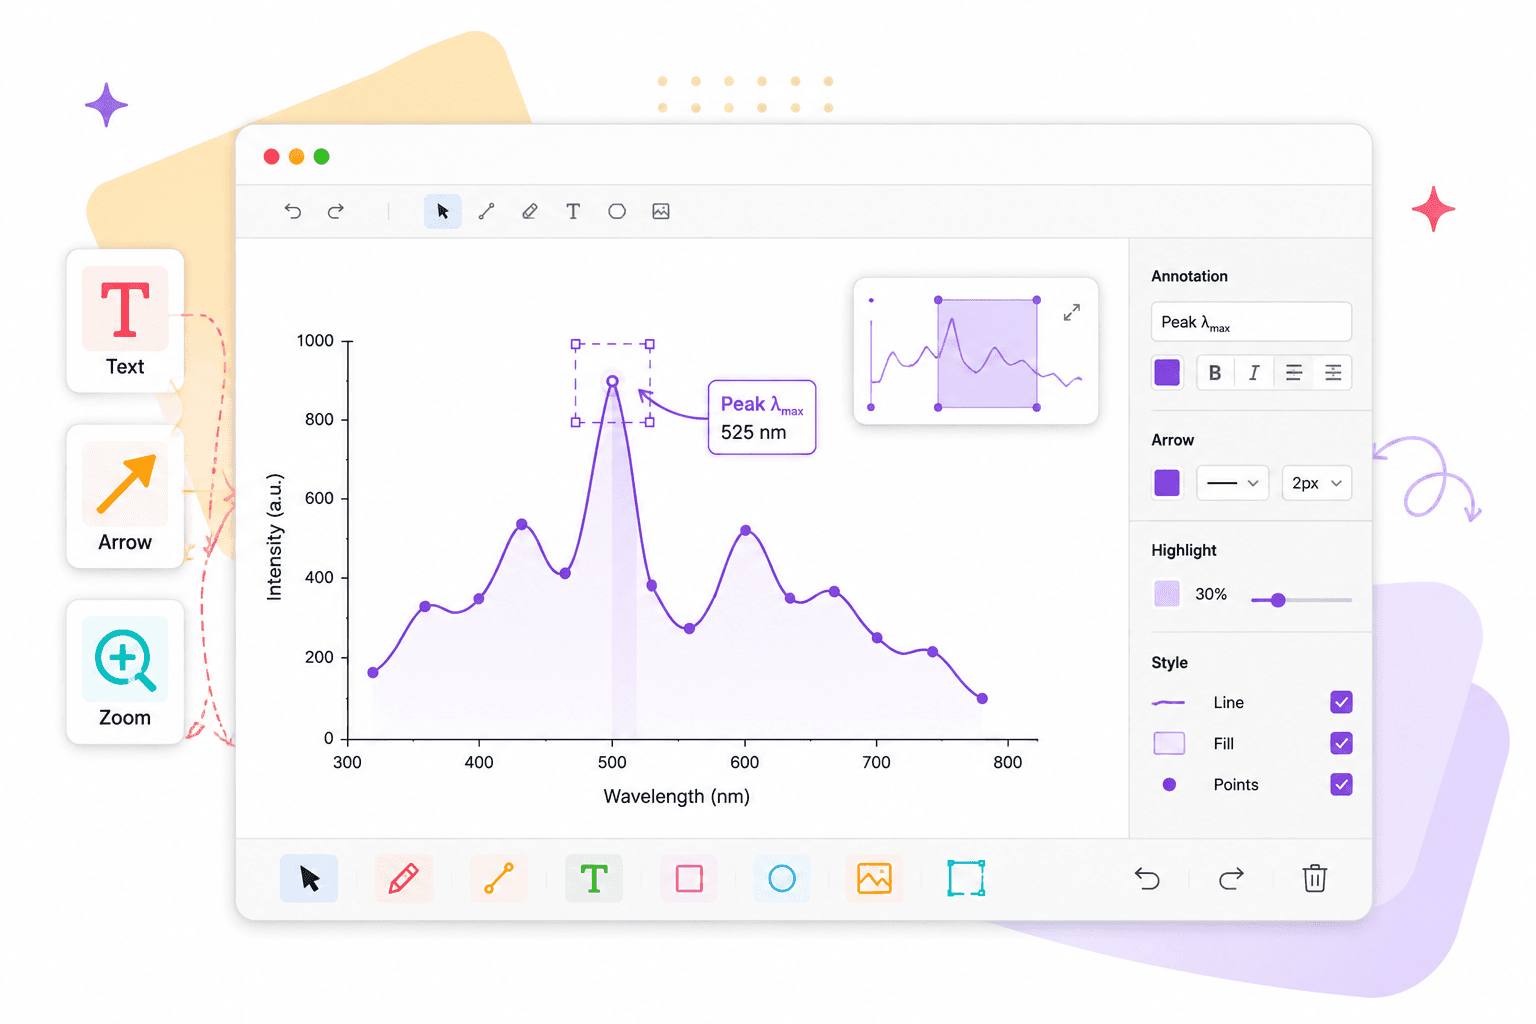
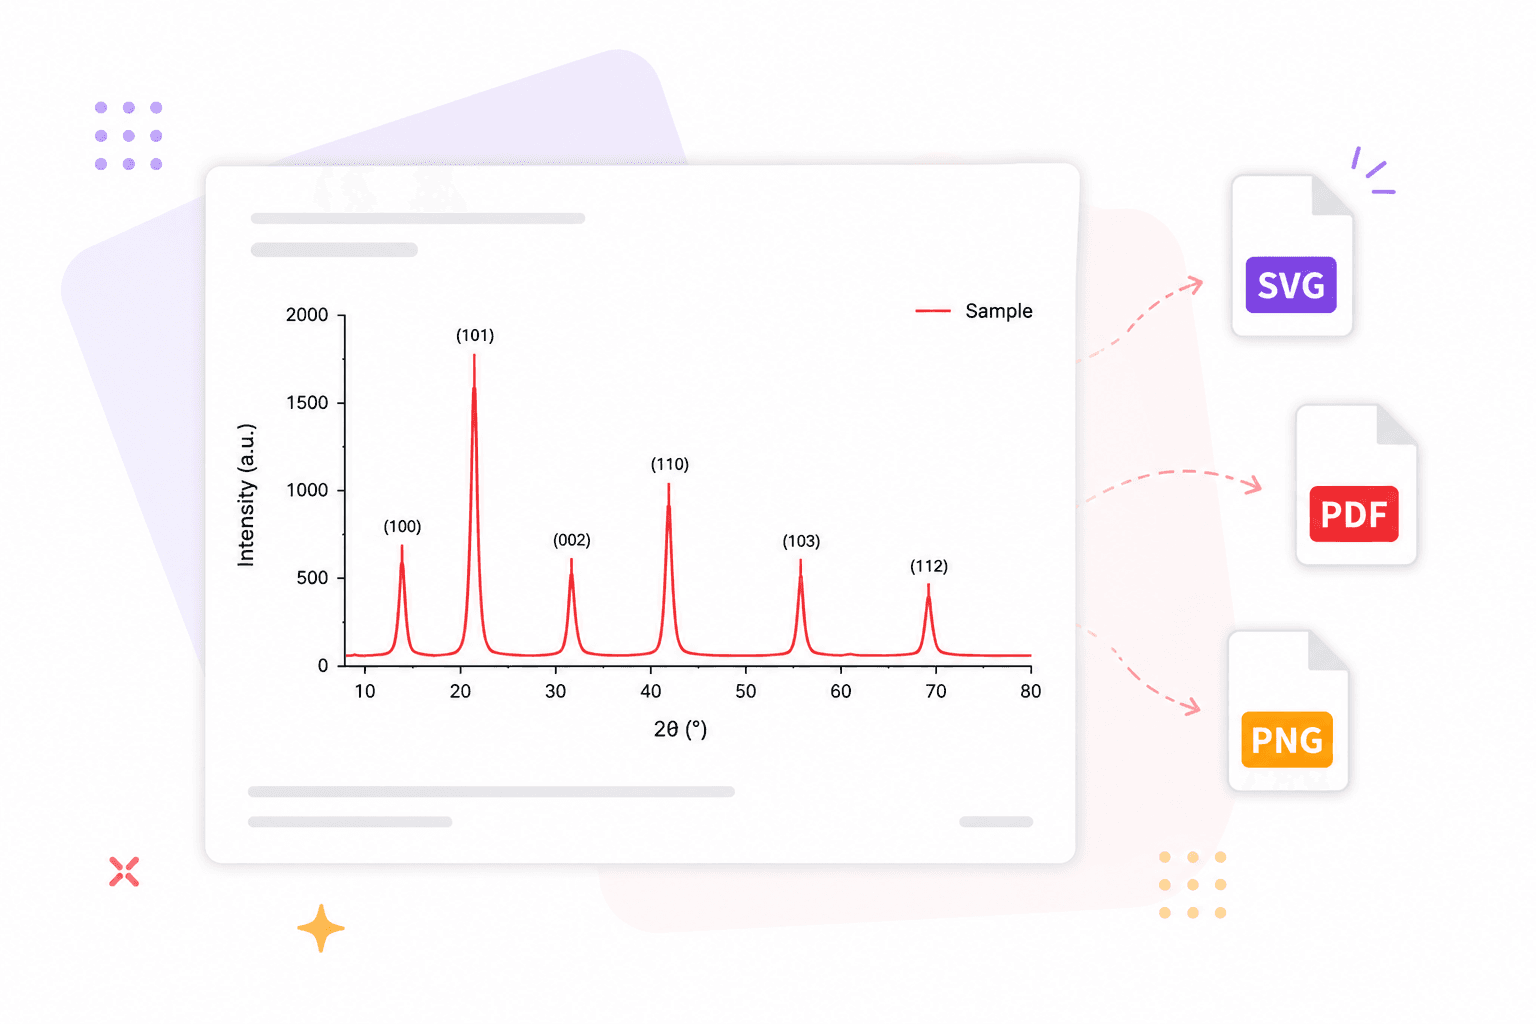
Ready for wherever your science goes
Finish your figure and export it in the format you need for your manuscript, presentation or supplementary material.
SVG · PDF · PNG
Create your first figureWhy researchers choose FigureReady
See how we compare to the tools you already know.
| Feature | ★ RecommendedFigureReady Pro | GraphPad Prism | OriginPro | Excel |
|---|---|---|---|---|
| Price | €99 / year | $840 / year | $1,500 / year | Included |
| Browser-based | ||||
| No installation | ||||
| Excel upload | Limited | |||
| TIFF 300 dpi export | ||||
| Journal templates | ||||
| Colorblind palettes | ||||
| Statistical annotations | ||||
| Panel figures | ||||
| Time to first figure | 30 seconds | 30 minutes | 45 minutes | 2 hours |
| Learning curve | None | Steep | Very steep | Medium |
Prices as of 2026. GraphPad and OriginPro require an institutional or personal license.
Pricing
Choose the plan that fits your research
Start for free, upgrade when you need more.
Free
No account required
- 1 free export
- PNG at 150 DPI
- Line, bar & scatter charts
- Excel upload (.xlsx)
- Watermark included
- TIFF / EPS export
- Custom figure size (mm/cm)
- Statistical significance annotations
- Panel figures (Fig. 1A, 1B, 1C)
- Journal-specific templates
- Priority support
Pro
≈ €8.25/month · Save 31%
- Unlimited exports
- PNG · SVG · PDF · TIFF · EPS
- 300 / 600 / 1200 DPI — your choice
- Custom figure size in mm/cm (Nature, Science, Cell dimensions built-in)
- No watermark
- Error bars & log scale
- Panel figures — combine multiple plots (Fig. 1A, 1B, 1C)
- Colorblind-friendly palettes (required by Nature & Cell)
- Scientific fonts — Arial, Helvetica, Times New Roman
- Customizable line width, marker size, axis ticks
- 7-day money-back guarantee
- Priority support
7-day money-back guarantee · Secure payment via Polar
Your data is ready.
Your figure should be too.
Create publication-ready scientific figures without rebuilding every plot from scratch.
Start free · No installation required